
Note that many Weather sites will display "pop-under" ads.
|
eLivermore.com - By Bill Nale |
|
Weather |
|
Back to Home Page - General Information Page - Sign our Guestbook |
|
|
|
Contents |
|
||||||||||||
|
|
|||||||||||||
|
Weather Links Note that many Weather sites will display "pop-under" ads. |
||
| Historical Weather | temperature averages for Livermore - San Francisco - San Jose. From Washington Post. | |
| The Weather Channel | For Livermore - Pleasanton - Dublin - San Ramon | |
| Yahoo Weather | for Livermore - Pleasanton, - Dublin - San Ramon - Sunol | |
| The Weather Underground for | Livermore, - Pleasanton - Dublin - San Ramon - All give Livermore readings. | |
| National Weather Service Home | SF Bay - Livermore Airport | |
| AWS Live Weather | from Las Positas College | |
| Weather Station at Cliff Ranch | Pleasanton | |
| back to top - Home Page | ||
| Jan | Feb | March | April | May | June | July | Aug | Sept | Oct | Nov | Dec | Annual | |
| Average Max. Temperature (F) | 56.6 | 60.9 | 64.9 | 70.5 | 76.8 | 83.3 | 89.4 | 88.8 | 86.5 | 78.2 | 66.0 | 57.4 | 73.3 |
| Record High Temp (F) & year | 75 1976 |
80 1977 |
88 1988 |
96 1981 |
104 2001 |
113 1961 |
112 1961 |
112 1946 |
115 1950 |
106 1980 |
90 1949 |
79 1958 |
|
| Average Min. Temperature (F) | 36.3 | 39.0 | 41.0 | 43.4 | 47.7 | 51.7 | 54.2 | 54.0 | 52.5 | 47.6 | 40.9 | 36.9 | 45.4 |
| Record Lo Temp (F) & Year | 18 1961 |
23 1950 |
22 1971 |
29 1976 |
32 1952 |
38 1968 |
36 1974 |
40 1977 |
35 1950 |
29 1971 |
23 1961 |
18 1990 |
|
| Average Temperature (F) | 46.1 | 50.4 | 52.7 | 56.6 | 61.9 | 67.7 | 71.6 | 71.4 | 69.0 | 62.7 | 53.0 | 46.3 | 59.1 |
| Average Total Precipitation (in.) | 2.93 | 2.55 | 2.09 | 1.10 | 0.44 | 0.10 | 0.02 | 0.05 | 0.16 | 0.69 | 1.75 | 2.59 | 14.46 |
Note there is no separate data available for Pleasanton, Dublin, or San Ramon.
November 10, 2003, about 2:07 PM.
It did not hail everywhere in Livermore, as evidenced by the fact that there was
a rainbow at this time also.
The hail was slightly larger than pea sized. As you can see there was
quite a lot of it.
This photo was taken north of Concannon, east of Isabel, near Max Baer Park..

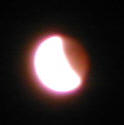
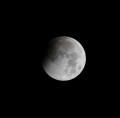
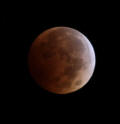
May 15, 2003 Eclipse photos by Bill Nale, taken from Max Baer Park
 |
 |
 |
 |
 |
 |
| Full Eclipse About 9:06 |
9:14 | 9:24 | 8:33 | 9:50 | 10:12 |
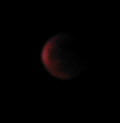
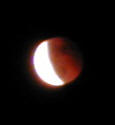
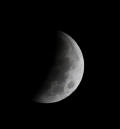
October 8, 2014 Lunar Eclipse. Photos by
Bill Nale, taken near Max Baer Park
Click here for larger photos
 |
 |
 |
 |
 |
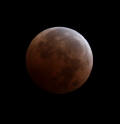 |
| 1:36:37AM | 2:17:23 AM | 2:49:11 AM | 3:20:41 AM | 3:47:35 AM | 4:20:42 AM |
Lunar Eclipse Links: US Naval Observatory, Griffith Observatory
|
Precipitation and Temperature Data |
This Year Precipitation Temperature |
Previous Year Precipitation Temperature |
Prior Years Daily Data Precipitation Temperature
|
Monthly
Historical data 1876 to 2024 for Raimfall |
Daily precipitation and temperature in Livermore. Updated
Weekly.
From the
National Oceanic and Atmospheric Administration
(National Weather Service)
The rainfall year begins July 1 and goes through June 30.
The current recording location is near Max Baer Park in southwest Livermore
Rainfall July 2026 to
June 2027
Generally updated daily
Key & Notes -
Previous Year
|
Day |
July 2026 | Aug 2026 | Sept 2026 | Oct 2026 | Nov 2026 | Dec 2026 | Jan 2027 |
Feb 2027 |
March 2027 | April 2027 | May 2027 | June 2027 |
| 1 | 0 | |||||||||||
| 2 | 0 | |||||||||||
| 3 | 0 | |||||||||||
| 4 | 0 | |||||||||||
| 5 | 0 | |||||||||||
| 6 | 0 | |||||||||||
| 7 | 0 | |||||||||||
| 8 | 0 | |||||||||||
| 9 | 0 | |||||||||||
| 10 | 0 | |||||||||||
| 11 | 0 | |||||||||||
| 12 | Trace | |||||||||||
| 13 | Trace | |||||||||||
| 14 | 0 | |||||||||||
| 15 | 0 | |||||||||||
| 16 | 0 | |||||||||||
| 17 | 0 | |||||||||||
| 18 | 0 | |||||||||||
| 19 | 0 | |||||||||||
| 20 | 0 | |||||||||||
| 21 | 0 | |||||||||||
| 22 | 0 | |||||||||||
| 23 | ||||||||||||
| 24 | ||||||||||||
| 25 | ||||||||||||
| 26 | ||||||||||||
| 27 | ||||||||||||
| 28 | ||||||||||||
| 29 | ||||||||||||
| 30 | ||||||||||||
| 31 | ||||||||||||
| Monthly Totals | 0 | 0 | 0 | 0 | 0 | 0 | 0 | 0 | 0 | 0 | 0 | 0 |
| Monthly Average | 0.01 | 0.03 | 0.23 | 0.71 | 1.63 | 2.64 | 2.92 | 2.46 | 2.18 | 1.09 | 0.46 | 0.11 |
| Monthly compare | 0.0% | |||||||||||
| YTD totals | 0 | 0 | 0 | 0 | 0 | 0 | 0 | 0 | 0 | 0 | 0 | 0 |
| YTD Average | 0.01 | 0.04 | 0.27 | 0.98 | 2.61 | 5.25 | 8.17 | 10.63 | 12.81 | 13.90 | 14.36 | 14.47 |
| YTD compare ** | 0.0% |
* Last number with a "*" is the total for all of the
sequence of days
** YTD compare assumes the end of month, so during a month it will tend to be
low.
Temperature Data for this year
(Note this is the CALENDAR year)
Data is generally entered daily
Temperature data for 2026
See below for 2025
|
Day |
Year | Jan 2026 | Feb 2026 | March 2026 | April 2026 | May 2026 | June 2026 | July 2026 | Aug 2026 | Sept 2026 | Oct 2026 | Nov 2026 | Dec 2026 | Day | |||||||||||||
| Min | Max | Min | Max | Min | Max | Min | Max | Min | Max | Min | Max | Min | Max | Min | Max | Min | Max | Min | Max | Min | Max | Min | Max | Min | Max | ||
| 1 | 46.6 | 59.4 | 38.1 | 68.1 | 50.8 | 70.0 | 53.8 | 65.1 | 48.8 | 78.8 | 50.9 | 91.6 | 54.2 | 81.5 | 1 | ||||||||||||
| 2 | 57.3 | 60.8 | 35.4 | 69.5 | 51.2 | 66.3 | 44.4 | 65.7 | 51.8 | 68.6 | 51.8 | 86.1 | 53.9 | 83.9 | 2 | ||||||||||||
| 3 | 49.7 | 61.0 | 35.6 | 62.8 | 46.3 | 71.2 | 40.9 | 72.9 | 53.2 | 64.7 | 50.2 | 83.1 | 53.5 | 90.7 | 3 | ||||||||||||
| 4 | 48.2 | 55.8 | 34.8 | 64.3 | 47.4 | 66.3 | 42.0 | 80.1 | 48.3 | 64.4 | 51.6 | 86.6 | 54.9 | 90.9 | 4 | ||||||||||||
| 5 | 43.5 | 57.9 | 37.0 | 66.8 | 38.5 | 66.5 | 46.6 | 86.2 | 51.0 | 61.5 | 52.9 | 90.4 | 55.7 | 86.9 | 5 | ||||||||||||
| 6 | 48.6 | 58.2 | 42.9 | 73.1 | 45.5 | 68.1 | 48.6 | 74.4 | 51.5 | 77.9 | 53.8 | 74.6 | 56.3 | 82.9 | 6 | ||||||||||||
| 7 | 42.5 | 58.2 | 41.2 | 68.8 | 45.0 | 72.5 | 47.1 | 75.9 | 52.7 | 80.8 | 47.4 | 82.3 | 54.9 | 72.8 | 7 | ||||||||||||
| 8 | 37.6 | 54.2 | 39.3 | 71.3 | 44.8 | 78.0 | 48.6 | 82.9 | 51.8 | 74.1 | 48.8 | 75.5 | 53.8 | 83.5 | 8 | ||||||||||||
| 9 | 40.7 | 53.6 | 45.2 | 61.4 | 45.4 | 75.6 | 52.4 | 80.2 | 47.0 | 80.8 | 58.3 | 79.6 | 53.0 | 93.1 | 9 | ||||||||||||
| 10 | 30.0 | 54.2 | 39.0 | 57.5 | 42.9 | 69.7 | 53.7 | 69.0 | 51.9 | 82.2 | 53.9 | 96.6 | 52.8 | 84.9 | 10 | ||||||||||||
| 11 | 31.0 | 60.4 | 49.9 | 59.0 | 39.7 | 74.9 | 49.2 | 62.9 | 47.9 | 92.6 | 61.9 | 99.8 | 51.2 | 91.2 | 11 | ||||||||||||
| 12 | 32.1 | 57.2 | 38.6 | 61.8 | 42.8 | 81.4 | 47.0 | 57.7 | 52.8 | 80.5 | 61.2 | 97.8 | 62.2 | 96.6 | 12 | ||||||||||||
| 13 | 31.6 | 63.0 | 39.8 | 62.6 | 41.9 | 76.4 | 47.8 | 66.2 | 54.1 | 71.3 | 57.4 | 98.0 | 68.8 | 90.0 | 13 | ||||||||||||
| 14 | 33.4 | 62.4 | 40.6 | 62.1 | 44.4 | 76.8 | 47.6 | 65.8 | 45.8 | 85.3 | 57.4 | 91.8 | 62.2 | 102.3 | 14 | ||||||||||||
| 15 | 33.8 | 62.8 | 45.0 | 65.3 | 45.7 | 79.4 | 47.1 | 66.8 | 47.6 | 84.6 | 56.0 | 88.1 | 65.5 | 98.9 | 15 | ||||||||||||
| 16 | 35.1 | 68.1 | 45.9 | 54.0 | 47.5 | 83.3 | 46.2 | 70.9 | 50.7 | 77.3 | 56.5 | 87.2 | 56.9 | 84.1 | 16 | ||||||||||||
| 17 | 33.7 | 61.8 | 42.0 | 46.8 | 49.5 | 84.0 | 47.5 | 74.5 | 46.0 | 76.5 | 57.4 | 86.8 | 52.5 | 83.5 | 17 | ||||||||||||
| 18 | 38.9 | 62.8 | 34.2 | 50.6 | 51.4 | 87.2 | 40.1 | 79.4 | 60.6 | 82.2 | 58.5 | 82.6 | 54.5 | 88.0 | 18 | ||||||||||||
| 19 | 34.6 | 65.2 | 39.6 | 53.1 | 52.8 | 86.7 | 48.7 | 79.3 | 47.7 | 88.2 | 57.2 | 79.8 | 55.8 | 90.0 | 19 | ||||||||||||
| 20 | 34.9 | 56.9 | 31.1 | 53.0 | 52.4 | 90.6 | 44.5 | 71.4 | 51.5 | 91.5 | 60.3 | 78.0 | 61.4 | 89.6 | 20 | ||||||||||||
| 21 | 39.0 | 57.3 | 31.6 | 62.5 | 53.5 | 82.0 | 51.5 | 58.7 | 52.3 | 91.8 | 55.5 | 86.6 | 67.0 | 98.8 | 21 | ||||||||||||
| 22 | 40.9 | 64.6 | 36.1 | 68.1 | 46.9 | 82.3 | 44.5 | 67.6 | 50.8 | 87.3 | 55.3 | 83.0 | 65.6 | 82.5 | 22 | ||||||||||||
| 23 | 38.1 | 53.6 | 39.5 | 69.0 | 46.9 | 84.6 | 42.6 | 74.5 | 50.6 | 81.2 | 54.8 | 85.9 | 56.9 | 85.6 | 23 | ||||||||||||
| 24 | 40.7 | 61.6 | 54.0 | 74.7 | 47 | 84.7 | 48.0 | 70.7 | 52.1 | 76.8 | 53.6 | 85.9 | 24 | ||||||||||||||
| 25 | 32.7 | 50.3 | 56.7 | 69.9 | 44.8 | 79.7 | 51.8 | 59.0 | 52.5 | 71.7 | 54.9 | 81.0 | 25 | ||||||||||||||
| 26 | 39.8 | 54.8 | 49.1 | 72.4 | 44.9 | 75.9 | 49.8 | 62.0 | 52.7 | 68.2 | 54.7 | 75.3 | 26 | ||||||||||||||
| 27 | 33.9 | 66.4 | 49.4 | 77.3 | 47.1 | 82.4 | 47.9 | 67.3 | 50.0 | 74.4 | 57.2 | 73.3 | 27 | ||||||||||||||
| 28 | 43.8 | 60.0 | 51.8 | 80.7 | 45.0 | 84.5 | 44.0 | 74.5 | 52.4 | 66.5 | 48.5 | 84.8 | 28 | ||||||||||||||
| 29 | 37.6 | 65.1 | 48.2 | 89.2 | 45.6 | 79.9 | 55.0 | 68.9 | 52.8 | 87.7 | 29 | ||||||||||||||||
| 30 | 37.4 | 62.1 | 50.6 | 79.3 | 46.2 | 78.6 | 52.8 | 78.8 | 53.6 | 86.2 | 30 | ||||||||||||||||
| 31 | 37.3 | 62.2 | 56.0 | 67.4 | 45.9 | 86.6 | 31 | ||||||||||||||||||||
| Month min/max | 30.0 | 68.1 | 31.1 | 80.7 | 38.5 | 90.6 | 40.1 | 86.2 | 45.8 | 92.6 | 47.4 | 99.8 | 51.2 | 102.3 | Month min/max | ||||||||||||
| Monthly Average | 38.9 | 59.7 | 41.6 |
64.5 |
47.0 | 78.0 | 47.2 | 71.3 | 51.0 | 77.9 | 54.8 | 85.1 | 57.5 | 88.4 | Monthly Average | ||||||||||||
| Historical: | Historical: | ||||||||||||||||||||||||||
| Average * | 45.6 | 73.2 | 36.7 | 56.8 | 39.4 | 61.2 | 41.3 | 65.2 | 43.6 | 70.5 | 47.6 | 76.4 | 51.7 | 83.1 | 54.2 | 89.0 | 54.0 | 88.2 | 52.5 | 86.0 | 47.7 | 77.7 | 41.1 | 66.3 | 37.0 | 57.5 | Average |
| Mean * | 24.5 | 106.3 | 26.4 | 66.9 | 29.5 | 71.4 | 32.1 | 77.9 | 34.9 | 85.8 | 39.3 | 94.3 | 44.4 | 102.0 | 47.7 | 104.3 | 47.8 | 102.8 | 44.5 | 101.2 | 38.3 | 92.6 | 30.5 | 79.0 | 26.7 | 67.8 | Mean |
| Record * | 18 | 113 | 18 | 77 | 21 | 80 | 22 | 88 | 29 | 96 | 32 | 108 | 38 | 113 | 36 | 113 | 36 | 112 | 35 | 115 | 29 | 110 | 22 | 93 | 18 | 79 | Record |
Month min/max is the lowest and highest temperature for the month this year.
Monthly Average is the average for this month, this year. For an
incomplete month, it is the average so far.
*
Historical Average is the average for this month, days, all years.
*
Historical Mean min/max for months: The average min (or max) for all
years. I.E. Average of: (lowest low (or highest high) in Oct 2021, lowest
low (or highest high) in Oct 2020........)
*
Historical Mean min/max for year: The average min (or max) across years.
I.E. Average of (lowest low (or highest high) in 2021, lowest low (or highest
high) in 2020.......) Min is lower than any monthly, Max is higher than
any monthly as the min (or max) for a year do not always occur in the same
month.
*
Historical Record: Lowest (highest) temperature ever recorded in that
month or year.
*
Historical data taken from Wikipedia.
Rainfall July 2025 to
June 2026
Generally updated daily
Key & Notes -
Previous Year
|
Day |
July 2025 | Aug 2025 | Sept 2025 | Oct 2025 | Nov 2025 | Dec 2025 | Jan 2026 |
Feb 2026 |
March 2026 | April 2026 | May 2026 | June 2026 |
| 1 | 0 | 0 | 0 | 0.02 | 0 | 0 | 0.53 | 0 | 0 | 0.05 | 0 | 0 |
| 2 | 0 | 0 | Trace | 0.65 | 0 | 0 | 0.02 | 0 | Trace | 0.22 | 0 | 0 |
| 3 | 0 | 0 | 0 | 0.01 | 0 | 0 | 0.07 | 0 | 0 | 0 | 0 | 0 |
| 4 | 0 | 0 | 0 | 0 | 0 | 0 | 1.26 | 0 | 0 | 0 | 0 | 0 |
| 5 | 0 | 0 | 0 | 0 | 0.04 | 0 | 0.09 | 0 | 0 | 0 | 0.04 | 0 |
| 6 | 0 | 0 | 0 | 0 | 0 | 0 | 0.03 | 0 | 0 | 0 | 0 | 0 |
| 7 | 0 | 0 | 0 | 0 | 0 | 0 | 0.03 | 0 | 0 | 0 | 0 | 0 |
| 8 | 0 | 0 | 0 | 0 | 0 | 0 | 0.05 | 0 | 0 | Trace | 0 | Trace |
| 9 | 0 | 0 | 0 | 0 | 0 | 0 | 0 | 0 | 0 | 0 | 0 | 0.01 |
| 10 | 0 | 0 | 0.06 | 0 | 0 | 0 | 0 | 0.11 | 0 | 0.19 | 0 | 0 |
| 11 | 0 | 0 | 0 | 0 | 0 | 0 | 0 | 0.05 | 0 | 0.63 | 0 | 0 |
| 12 | 0 | 0 | 0 | 0 | 0.01 | 0 | 0 | 0 | 0 | 0.39 | 0 | 0 |
| 13 | 0 | 0 | 0 | 1.22 | 0.79 | 0 | 0 | 0 | 0 | 0 | 0 | 0 |
| 14 | 0 | 0 | 0 |
0.29 |
Trace | 0 | 0 | 0 | 0 | 0 | 0 | 0 |
| 15 | 0 | 0 | 0 | 0.02 | Trace | 0.02 | 0 | 0.03 | 0 | 0 | 0 | 0 |
| 16 | 0 | 0 | 0 | 0 | 0.37 | 0 | 0 | 1.32 | 0 | 0 | 0 | 0 |
| 17 | 0 | 0 | 0 | 0 | 0.73 | 0.03 | 0 | 1.30 | 0 | 0 | 0 | 0 |
| 18 | 0 | 0 | 0 | 0 | 0.08 | 0 | 0 | 0.25 | 0 | 0 | 0 | 0 |
| 19 | 0 | 0 | 0 | 0 | 0 | Trace | 0 | 0.30 | 0 | 0 | 0 | 0 |
| 20 | 0 | 0 | 0 | 0 | 0.23 | 0.04 | 0 | 0 | 0 | 0.01 | 0 | 0 |
| 21 | 0 | 0 | 0 | 0 | 0.05 |
Trace |
0 | 0 | 0 | 0.78 | 0 | 0 |
| 22 | 0 | 0 | 0 | 0 | 0 | 0.05 | 0 | 0 | 0 | 0.04 | 0 | 0 |
| 23 | 0 | 0 | 0 | 0 | 0 | 0 | 0 | 0 | 0 | 0 | 0 | 0 |
| 24 | 0 | 0 | 0.02 | 0 | 0 | 0.44 | 0 | 0.01 | 0 | 0 | 0 | 0 |
| 25 | 0 | 0 | 0.09 | 0.06 | 0 | 0.68 | 0 | 0.01 | 0 | Trace | 0 | 0 |
| 26 | 0 | 0 | 0 | 0.02 | 0 | 0.23 | 0 | 0 | 0 | 0.02 | 0 | Trace |
| 27 | 0 | 0 | 0 | 0.01 | 0 | 0 | 0 | 0 | 0 | 0 | Trace | 0.01 |
| 28 | 0 | 0 | 0 | 0 | 0 | 0.01 | 0 | 0 | 0 | 0 | 0.36 | 0 |
| 29 | 0 | 0 | 0 | 0 | 0 | 0 | 0 | 0 | 0 | 0.01 | 0 | |
| 30 | 0 | 0 | 0 | 0 | 0 | 0 | 0 | 0 | 0 | 0 | 0 | |
| 31 | 0 | 0 | 0 | 0.58 | 0 | 0.05 | 0 | |||||
| Monthly Totals | 0 | 0 | 0.17 | 2.30 | 2.30 | 2.08 | 2.08 | 3.38 | 0.05 | 2.33 | 0.41 | 0.02 |
| Monthly Average | 0.01 | 0.03 | 0.23 | 0.71 | 1.63 | 2.64 | 2.92 | 2.46 | 2.18 | 1.09 | 0.46 | 0.11 |
| Monthly compare | 0.0% | 0.0% | 73.9% | 323.9% | 141.1% | 78.8% | 71.2% | 137.4% | 2.3% | 213.8% | 89.1% | 18.2% |
| YTD totals | 0 | 0 | 0.17 | 2.47 | 4.77 | 6.85 | 8.93 | 12.31 | 12.36 | 14.69 | 15.10 | 15.12 |
| YTD Average | 0.01 | 0.04 | 0.27 | 0.98 | 2.61 | 5.25 | 8.17 | 10.63 | 12.81 | 13.90 | 14.36 | 14.47 |
| YTD compare ** | 0.0% | 0.0% | 63.0% | 252.0% | 182.8% | 130.5% | 109.3% | 115.8% | 96.5% | 105.7 | 105.2% | 104.5% |
* Last number with a "*" is the total for all of the
sequence of days
Key:
|
* |
Days Precipitation included in next day total. |
|
0 |
0 Precipitation on this day |
|
x.xx |
Inches of rainfall on this day |
|
Trace |
Trace amount (less than 0.01"). Counted as 0 in totals. |
| Data not available for this day yet | |
| Day does not occur in this month. |
Notes:
|
Day |
Year | Jan 2025 | Feb 2025 | March 2025 | April 2025 | May 2025 | June 2025 | July 2025 | Aug 2025 | Sept 2025 | Oct 2025 | Nov 2025 | Dec 2025 | Day | |||||||||||||
| Min | Max | Min | Max | Min | Max | Min | Max | Min | Max | Min | Max | Min | Max | Min | Max | Min | Max | Min | Max | Min | Max | Min | Max | Min | Max | ||
| 1 | 32 | 60 | 50 | 58 | 41 | 61 | 44 | 58 | 51 | 81 | 57 | 95 | 55 | 95 | 55 | 92.1 | 60.4 | 101.8 | 60.7 | 75.8 | 45.4 | 78.5 | 38.7 | 49.7 | 1 | ||
| 2 | 39 | 63 | 55 | 63 | 45 | 58 | 36 | 64 | 49 | 76 | 48 | 84 | 57 | 95 | 55.1 | 89.1 | 64.7 | 92.0 | 60.1 | 71.0 | 44.8 | 77.4 | 37.1 | 61.6 | 2 | ||
| 3 | 43 | 58 | 53 | 59 | 38 | 60 | 35 | 68 | 50 | 67 | 54 | 86 | 52 | 87 | 53.5 | 83.7 | 57.0 | 93.2 | 58.1 | 71.4 | 48.5 | 73.3 | 41.5 | 61.3 | 3 | ||
| 4 | 37 | 59 | 52 | 66 | 45 | 69 | 36 | 76 | 41 | 77 | 54 | 89 | 53 | 79 | 57.2 | 83.0 | 57.0 | 82.9 | 49.5 | 78.5 | 48.5 | 76.2 | 34.5 | 48.6 | 4 | ||
| 5 | 35 | 65 | 32 | 63 | 49 | 55 | 42 | 78 | 49 | 87 | 52 | 85 | 47 | 87 | 52.4 | 83 | 59.5 | 79.6 | 49.0 | 79.3 | 52.9 | 65.7 | 33.7 | 55.2 | 5 | ||
| 6 | 35 | 65 | 33 | 64 | 42 | 59 | 39 | 76 | 47 | 87 | 54 | 88 | 49 | 93 | 54.7 | 93 | 58.8 | 81.0 | 50.9 | 81.8 | 51.1 | 70.1 | 38.6 | 50.0 | 6 | ||
| 7 | 41 | 66 | 44 | 59 | 33 | 69 | 50 | 69 | 50 | 78 | 54 | 86 | 54 | 92 | 60.1 | 92 | 57 | 83.6 | 47.1 | 87.8 | 48.5 | 71.7 | 40.1 | 51.6 | 7 | ||
| 8 | 46 | 70 | 32 | 61 | 32 | 75 | 44 | 77 | 46 | 89 | 54 | 83 | 53 | 86 | 57.7 | 103.8 | 56.6 | 83.2 | 54.1 | 74.5 | 49.5 | 75.4 | 40.3 | 49.8 | 8 | ||
| 9 | 37 | 74 | 30 | 62 | 35 | 71 | 43 | 87 | 48 | 97 | 53 | 83 | 57 | 89 | 61.8 | 102.2 | 62.3 | 80.2 | 50.3 | 72.5 | 45.9 | 75.1 | 38.8 | 50.1 | 9 | ||
| 10 | 36 | 72 | 27 | 63 | 37 | 75 | 49 | 84 | 52 | 95 | 54 | 81 | 54 | 103 | 59.9 | 100.8 | 61.5 | 74.8 | 53.0 | 74.9 | 47.5 | 78.7 | 40.2 | 53.5 | 10 | ||
| 11 | 38 | 70 | 27 | 57 | 36 | 68 | 49 | 78 | 48 | 87 | 49 | 77 | 60 | 103 | 56.8 | 97.4 | 61.5 | 77.1 | 50.1 | 72.4 | 46.5 | 75.7 | 38.0 | 54.1 | 11 | ||
| 12 | 42 | 67 | 38 | 55 | 47 | 63 | 45 | 72 | 51 | 66 | 49 | 81 | 58 | 100 | 54.8 | 92.3 | 57.6 | 81.7 | 44.4 | 74.4 | 52.5 | 66.4 | 38.0 | 47.4 | 12 | ||
| 13 | 36 | 64 | 47 | 58 | 34 | 52 | 40 | 87 | 50 | 71 | 48 | 82 | 56 | 96 | 57.5 | 88.7 | 56.1 | 77.2 | 50.3 | 63.7 | 54.7 | 64.4 | 35.4 | 49.9 | 13 | ||
| 14 | 30 | 67 | 44 | 58 | 40 | 56 | 46 | 87 | 41 | 80 | 45 | 84 | 54 | 97 | 58.5 | 91.4 | 59.4 | 84.2 | 46.9 | 60 | 52.7 | 62.4 | 33.8 | 50.3 | 14 | ||
| 15 | 30 | 67 | 32 | 65 | 44 | 61 | 51 | 81 | 42 | 84 | 45 | 92 | 56 | 94 | 56.1 | 92.3 | 58 | 91.5 | 51.5 | 61.3 | 49.4 | 63.9 | 33.9 | 55.5 | 15 | ||
| 16 | 29 | 71 | 37 | 62 | 36 | 64 | 48 | 67 | 50 | 82 | 47 | 86 | 56 | 81 | 61.5 | 79.6 | 58.1 | 96.6 | 43.3 | 70.1 | 53.0 | 64.1 | 38.9 | 57.2 | 16 | ||
| 17 | 29 | 62 | 39 | 59 | 47 | 60 | 50 | 62 | 52 | 75 | 50 | 87 | 57 | 87 | 59.2 | 81.3 | 57.9 | 97.8 | 44.6 | 74.3 | 49.8 | 58.6 | 44.8 | 68.1 | 17 | ||
| 18 | 37 | 68 | 35 | 69 | 34 | 66 | 50 | 74 | 44 | 81 | 51 | 95 | 56 | 86 | 57.5 | 87.8 | 62.9 | 80.4 | 47.7 | 75.8 | 45.2 | 60.6 | 47.5 | 61.6 | 18 | ||
| 19 | 28 | 58 | 42 | 61 | 32 | 64 | 42 | 74 | 48 | 85 | 53 | 93 | 55 | 87 | 53.1 | 91.5 | 60.4 | 86.1 | 50.6 | 79.9 | 41.1 | 57.3 | 48.1 | 64.8 | 19 | ||
| 20 | 33 | 66 | 44 | 72 | 43 | 67 | 49 | 81 | 47 | 85 | 51 | 68 | 55 | 87 | 52.1 | 97.7 | 57.8 | 86.6 | 50.1 | 78.4 | 48.4 | 54.1 | 56.7 | 62.0 | 20 | ||
| 21 | 28 | 71 | 39 | 73 | 37 | 67 | 42 | 89 | 44 | 91 | 48 | 78 | 56 | 78 | 57.6 | 102.4 | 57.7 | 86.8 | 47.2 | 79.7 | 43.4 | 62.6 | 57.4 | 65.3 | 21 | ||
| 22 | 29 | 68 | 37 | 76 | 44 | 65 | 45 | 85 | 49 | 85 | 48 | 84 | 57 | 72 | 57.4 | 98.9 | 56.2 | 93.6 | 57.4 | 67.1 | 38.2 | 64.1 | 57.2 | 66.4 | 22 | ||
| 23 | 35 | 71 | 43 | 70 | 44 | 80 | 47 | 74 | 49 | 71 | 48 | 91 | 56 | 80 | 60.3 | 92.5 | 57.9 | 97.4 | 47.9 | 73.1 | 39.1 | 60.7 | 50.3 | 63.7 | 23 | ||
| 24 | 30 | 67 | 45 | 68 | 45 | 84 | 48 | 62 | 47 | 74 | 52 | 89 | 58 | 81 | 59.6 | 88.1 | 66.1 | 78.8 | 51.2 | 73.1 | 45.5 | 61.1 | 52.6 | 66.4 | 24 | ||
| 25 | 37 | 52 | 42 | 76 | 45 | 90 | 48 | 61 | 50 | 69 | 52 | 86 | 56 | 80 | 59.5 | 91.6 | 60.6 | 86.0 | 51.8 | 66.4 | 38.1 | 55.0 | 51.1 | 59.3 | 25 | ||
| 26 | 38 | 59 | 37 | 77 | 53 | 90 | 45 | 66 | 52 | 74 | 50 | 87 | 57 | 81 | 59.5 | 91.4 | 57.0 | 90.3 | 52.8 | 71.0 | 37.4 | 53.9 | 48.3 | 58.7 | 26 | ||
| 27 | 26 | 67 | 40 | 72 | 53 | 65 | 48 | 60 | 44 | 86 | 51 | 95 | 56 | 80 | 57.2 | 87.0 | 60 | 77.6 | 53.3 | 67.4 | 37.7 | 51.5 | 42.9 | 55.1 | 27 | ||
| 28 | 27 | 67 | 42 | 81 | 49 | 62 | 40 | 75 | 52 | 85 | 57 | 98 | 55 | 87 | 54.2 | 91.0 | 62.3 | 77.5 | 44.3 | 74.7 | 41.8 | 55.2 | 36.7 | 55.2 | 28 | ||
| 29 | 36 | 59 | 41 | 67 | 43 | 85 | 51 | 87 | 56 | 96 | 54 | 90 | 56.2 | 87.2 | 64.1 | 74.3 | 46.1 | 78.7 | 42.6 | 51.0 | 34.6 | 58.0 | 29 | ||||
| 30 | 37 | 59 | 48 | 69 | 47 | 84 | 52 | 103 | 57 | 96 | 55 | 85 | 55.7 | 100.8 | 59.7 | 77.4 | 47.1 | 75.2 | 42.7 | 47.4 | 32.0 | 46.0 | 30 | ||||
| 31 | 38 | 52 | 50 | 60 | 58 | 101 | 58 | 95 | 59.3 | 99.7 | 51.2 | 77.4 | 40.1 | 48.4 | 31 | ||||||||||||
| Month min/max | 26 | 103 | 26 | 74 | 27 | 81 | 32 | 90 | 35 | 89 | 41 | 103 | 45 | 98 | 47 | 103 | 52.1 | 103.8 | 56.1 | 101.8 | 43.3 | 87.8 | 37.4 | 78.7 | 33.7 | 68.1 | Month min/max |
| Monthly Average | 34.6 | 64.6 | 39.9 | 65.3 | 41.9 | 66.8 | 44.7 | 74.7 | 48.5 | 82.5 | 51.4 | 86.8 | 55.2 | 88.2 | 57.1 | 92.0 | 59.5 | 85.0 | 50.4 | 73.6 | 46.1 | 64.4 | 42.0 | 56.3 | Monthly Average | ||
| Historical: | Historical: | ||||||||||||||||||||||||||
| Average * | 45.6 | 73.2 | 36.7 | 56.8 | 39.4 | 61.2 | 41.3 | 65.2 | 43.6 | 70.5 | 47.6 | 76.4 | 51.7 | 83.1 | 54.2 | 89.0 | 54.0 | 88.2 | 52.5 | 86.0 | 47.7 | 77.7 | 41.1 | 66.3 | 37.0 | 57.5 | Average |
| Mean * | 24.5 | 106.3 | 26.4 | 66.9 | 29.5 | 71.4 | 32.1 | 77.9 | 34.9 | 85.8 | 39.3 | 94.3 | 44.4 | 102.0 | 47.7 | 104.3 | 47.8 | 102.8 | 44.5 | 101.2 | 38.3 | 92.6 | 30.5 | 79.0 | 26.7 | 67.8 | Mean |
| Record * | 18 | 113 | 18 | 77 | 21 | 80 | 22 | 88 | 29 | 96 | 32 | 108 | 38 | 113 | 36 | 113 | 36 | 112 | 35 | 115 | 29 | 110 | 22 | 93 | 18 | 79 | Record |
Month min/max is the lowest and highest temperature for the month this year.
Monthly Average is the average for this month, this year. For an
incomplete month, it is the average so far.
*
Historical Average is the average for this month, days, all years.
*
Historical Mean min/max for months: The average min (or max) for all
years. I.E. Average of: (lowest low (or highest high) in Oct 2021, lowest
low (or highest high) in Oct 2020........)
*
Historical Mean min/max for year: The average min (or max) across years.
I.E. Average of (lowest low (or highest high) in 2021, lowest low (or highest
high) in 2020.......) Min is lower than any monthly, Max is higher than
any monthly as the min (or max) for a year do not always occur in the same
month.
*
Historical Record: Lowest (highest) temperature ever recorded in that
month or year.
*
Historical data taken from Wikipedia.